So, I made a graph. Because, well, what else do you do when you have continuous data observed over time?
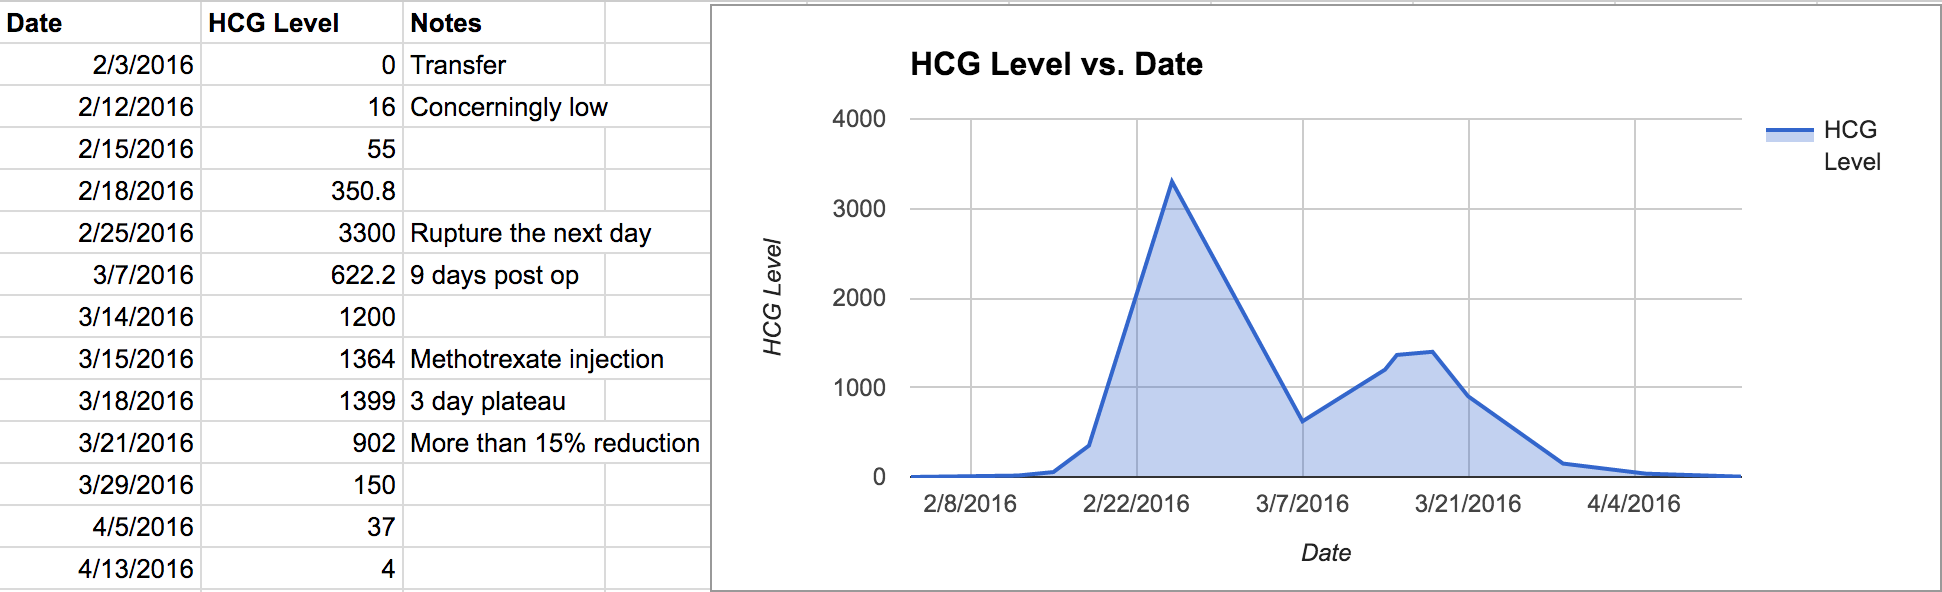
And here's a view of the story of our Riley, told in numbers. Hope exponentially rising for most of February, pain crashing down, new concerning growth, chemotherapy intervention, plateau, and denouement.